

Reports tell you what’s finished. They don’t tell you what’s slipping.
Overdue specimens, incomplete tests and stalled work orders hide in the noise. A data summary is the management lens that brings them into view.
See all your projects on one dashboard.
Field tests, inspections and lab tests. Outstanding work, reports ready for signing and anything else that needs attention.
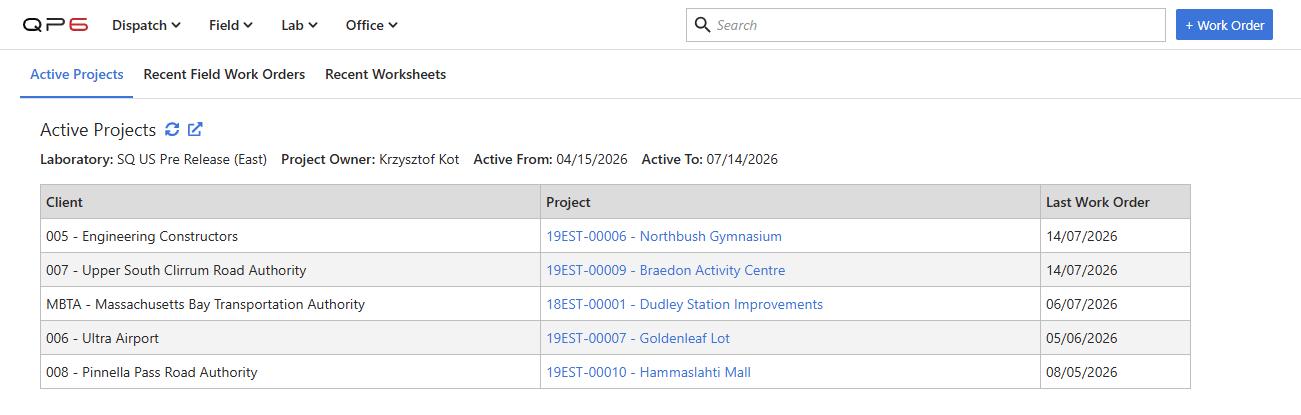
Drilldown from every metric.
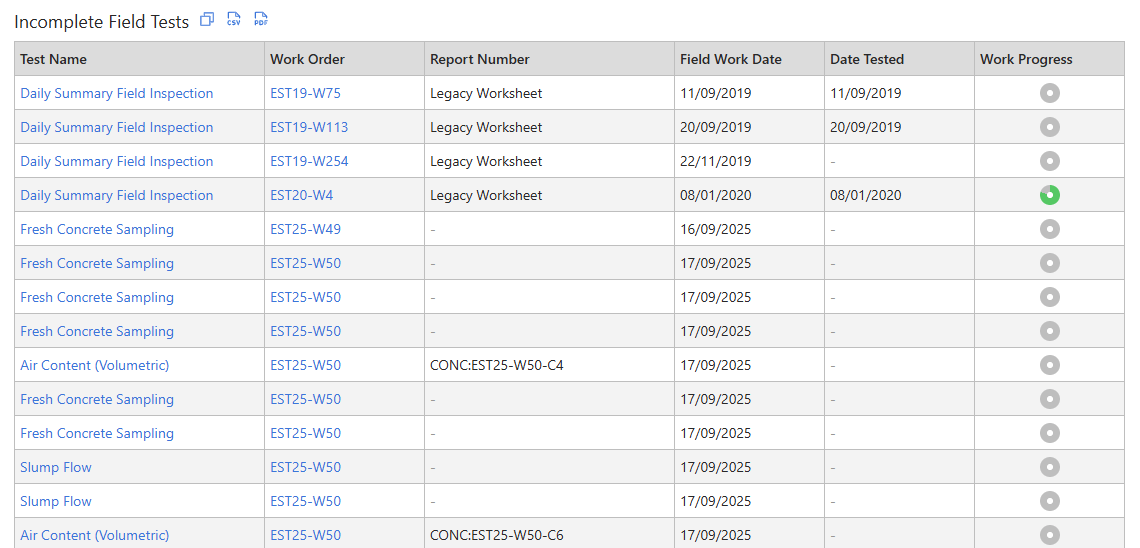
Click a metric, see a list of matching results, then the worksheet, sample, specimen or report behind it. Big picture to root cause in seconds.
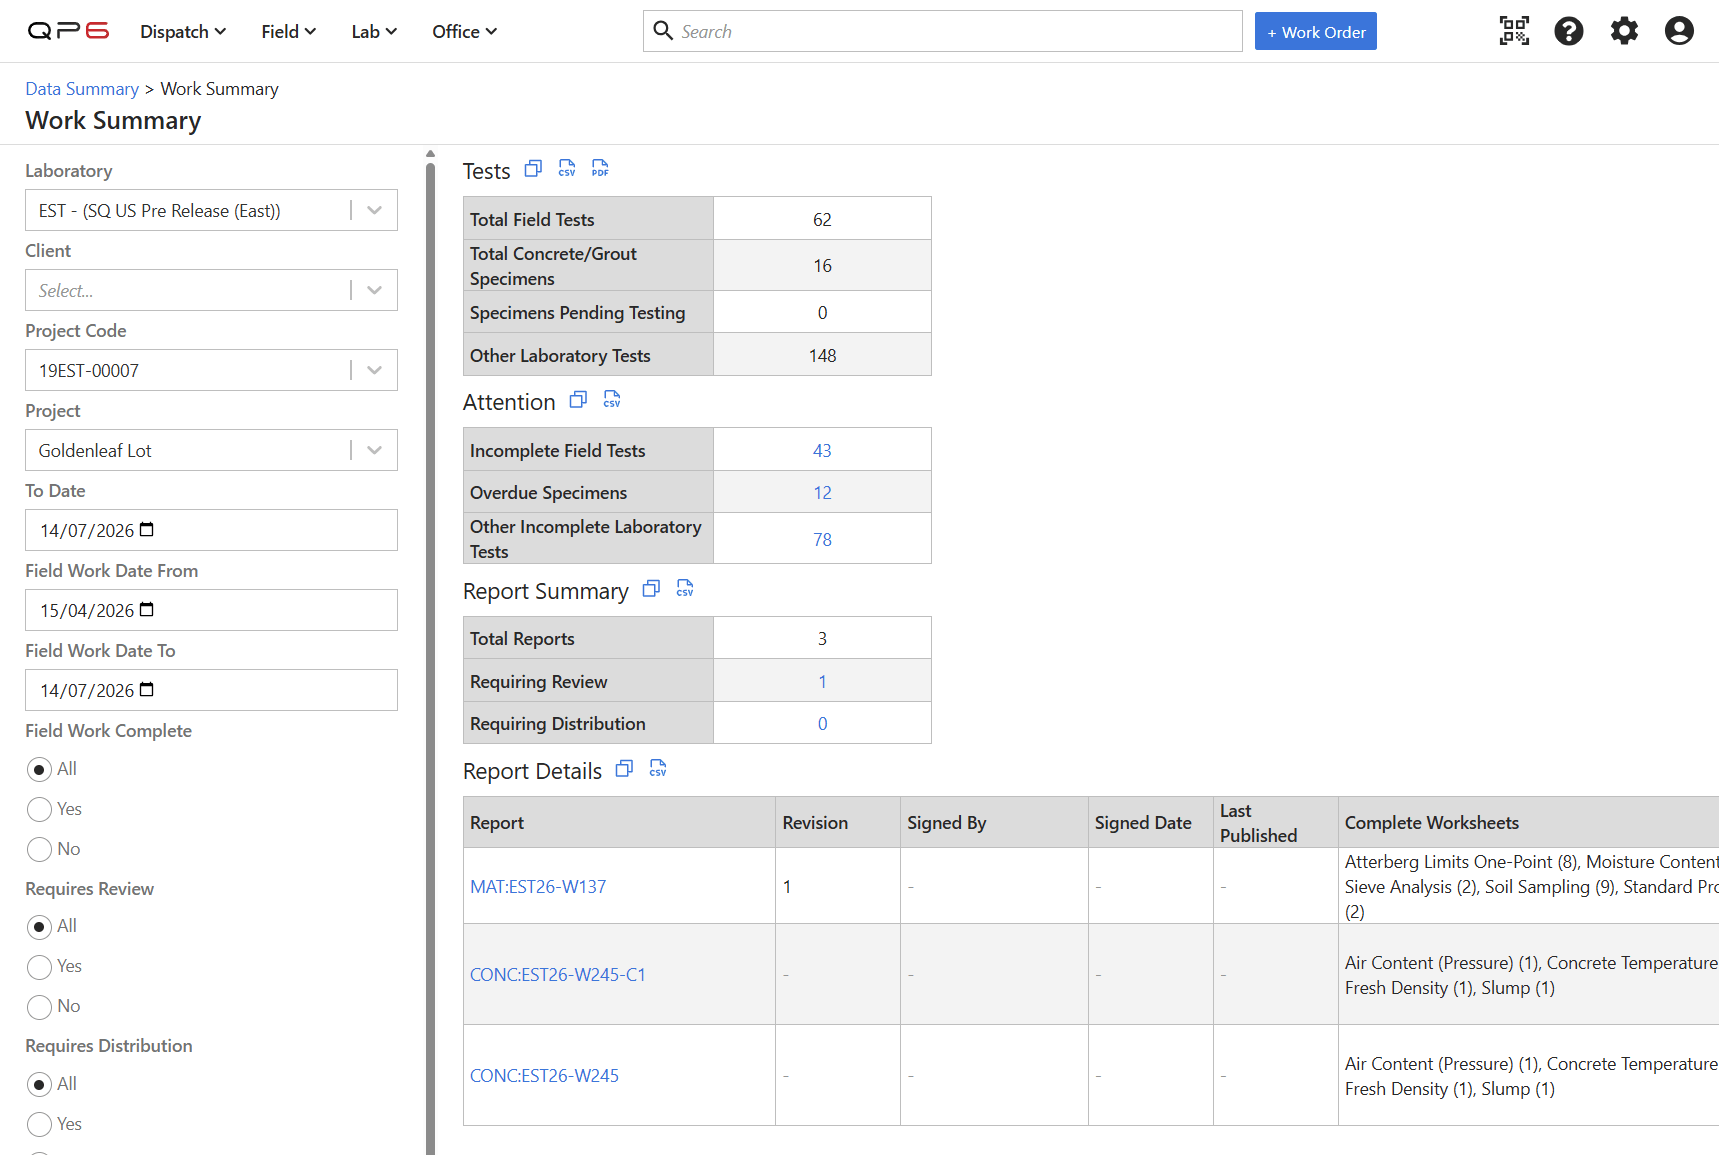
Know how testing is tracking, without asking.
Work progress updates automatically as technicians enter data. Built for multi-day lab tests where completion isn’t instant.
Send the view, not a spreadsheet.
A colleague opens the exact same view, same filters. No export required.
Data summaries are configuration, not code.
Results across projects with failures highlighted.
Trends like field and lab testing volumes.
Audit-ready equipment information on demand.
Highlight data for billing follow-up.
Turnaround times and work volumes by lab or project.
Set any summary as your home-page snapshot.